IE11 (+Win8.1.1) F12 Developer Tools for the SharePoint Dev
/
This blog post is about all the new nifty features I'm finding in the latest IE11 F12 developer tools. I updated my Windows to 8.1 update 1, and IE11 was updated. I started seeing a few cool new features, and went on Twitter to find the official documentation.
http://msdn.microsoft.com/en-us/library/ie/dn641599(v=vs.85).aspx
Was supplied by @AdamTReineke
https://twitter.com/AdamTReineke/status/454678702169677824
Rather than bore you with a list of features, which is on MSDN. I want to just quickly share how I'm using some of them.
Disclaimer - I had just watched LEGO movie. So EVERYTHING IS AWESOME!
DOM Explorer
1. CSS Changes
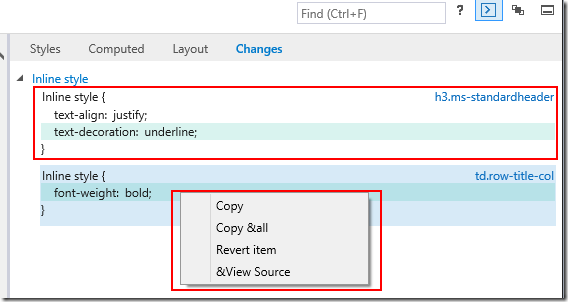
- When you "touch up" CSS in SharePoint to get the exact look you want. You often forget which rule you had applied.
- The DOM Explorer's "Changes" tab tracks all the individual changes, and you can revert an individual rule, or copy them all and paste to your CSS file.
- Copy All. Awesome!
2. Pseudo Rules
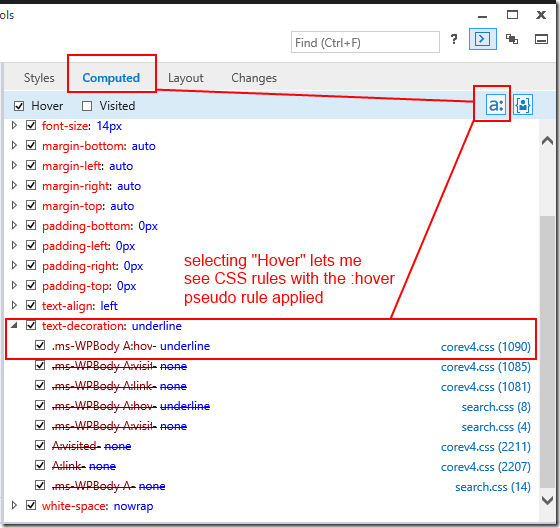
- You know those pesky :hover and :visited CSS rules in SharePoint that can never find to eliminate?
- Now you can apply :hover or :visited and see the effect rule without actually trying to catch your mouse hovering. Haha. Awesome!
The super cool updated Console object
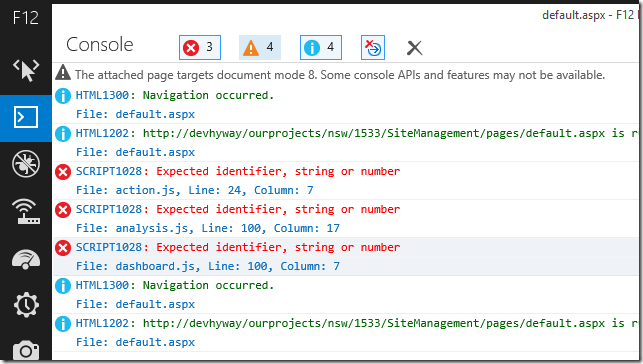
3. Console info, warning, error
- My "warnings" are currently filtered.
- use console.info() console.warn() and console.error() to write to these.
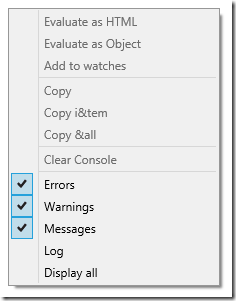
- No ribbon button but you can right-click to filter Log messages too. For those really spammy libraries, which is pretty awesome!
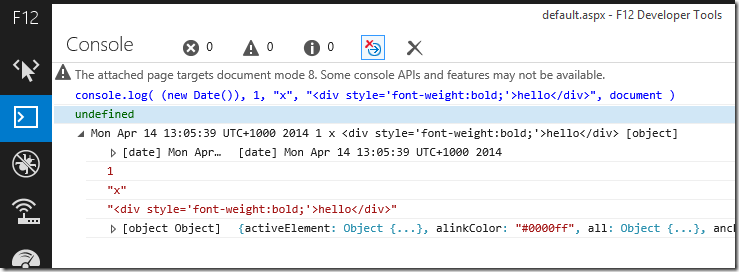
4. Console handles objects, multiple objects and HTML
- Chrome and Firefox both were able to log objects and inspect them. IE11 used to just log the [object].tostring which was pretty useless.
- The update now fixes that, and allow multiple arguments to be logged at the same time.
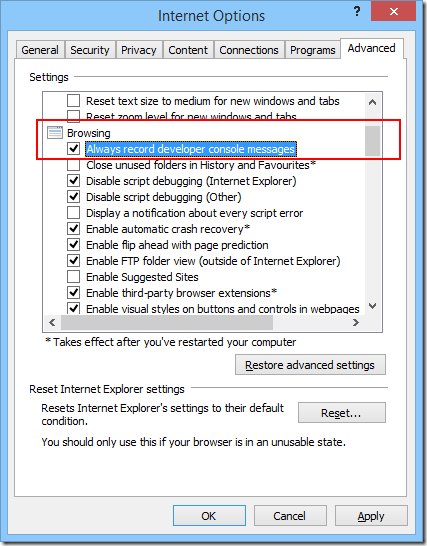
5. Console always available for dev.
- So you can have all your logs happening without trying to start the debugger before you load the page
- Remember your end users won't have this on, so TEST before you deploy code.
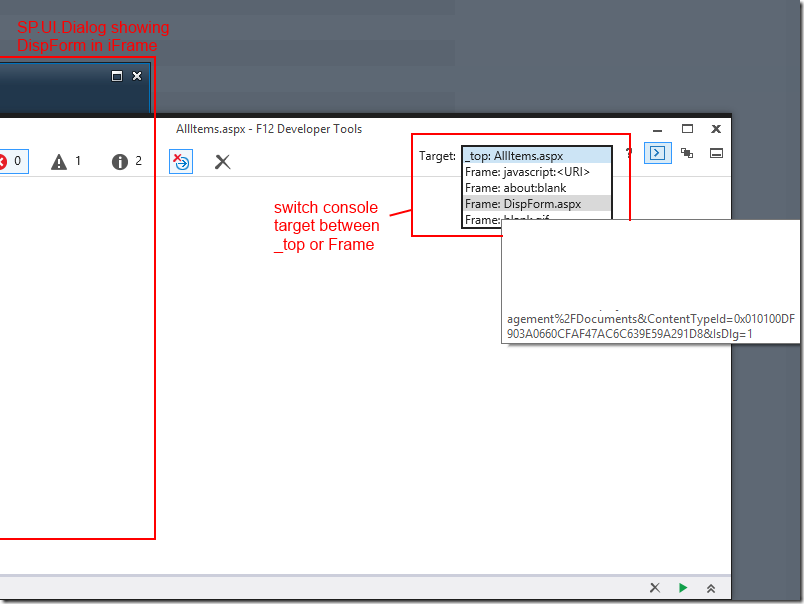
6. Console can switch target to an iFrame.
- Note, I couldn't get this to work in IE8-Compat mode (which my SP2010 runs on). This works fine for IE9, IE10, Edge.
- This is awesome for debugging objects in the SP.UI.Dialog
Debug
7. Debugger can be attached without reloading the page
- Not sure if we need a picture to describe how awesome this is. I imagine the picture will involve unicorns, rainbows and kittens. AWESOME!
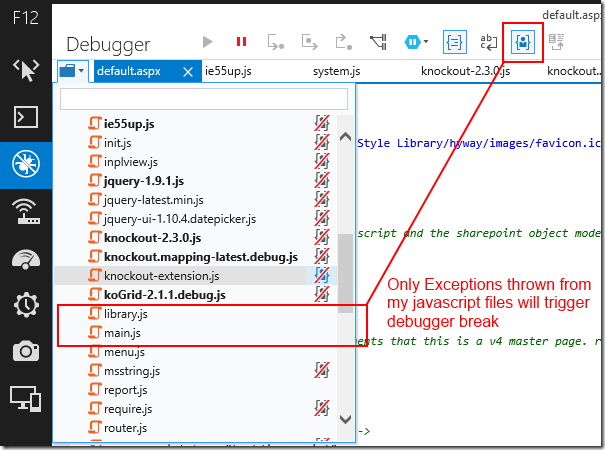
8. Just My code
- Debugger only stops on my code.
- Note, some libraries can throw error when you call it wrong - so sometimes not so awesome.
9. Pretty Print
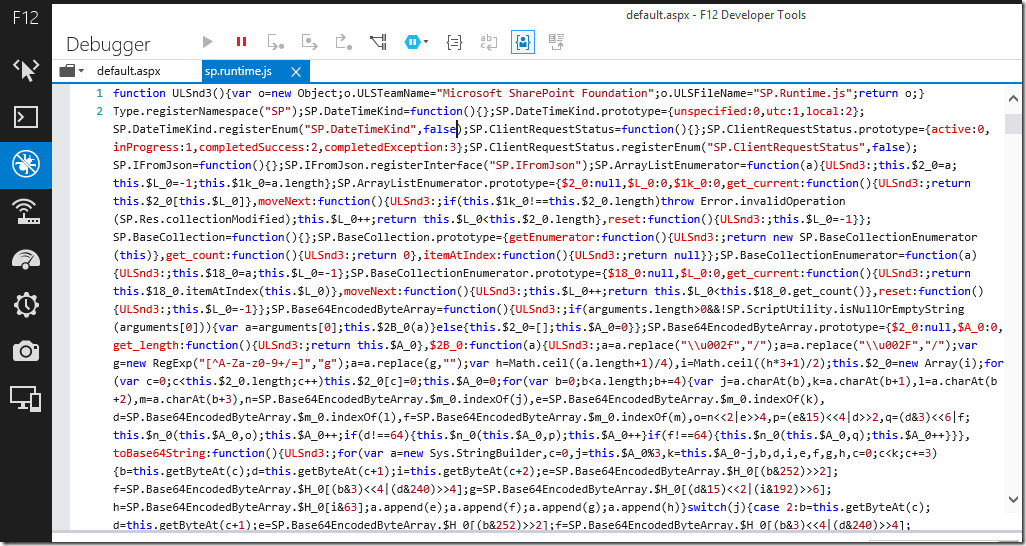
- Oh crap. Something in sp.runtime.js don't know how to read this...
- Not anymore in 2014!
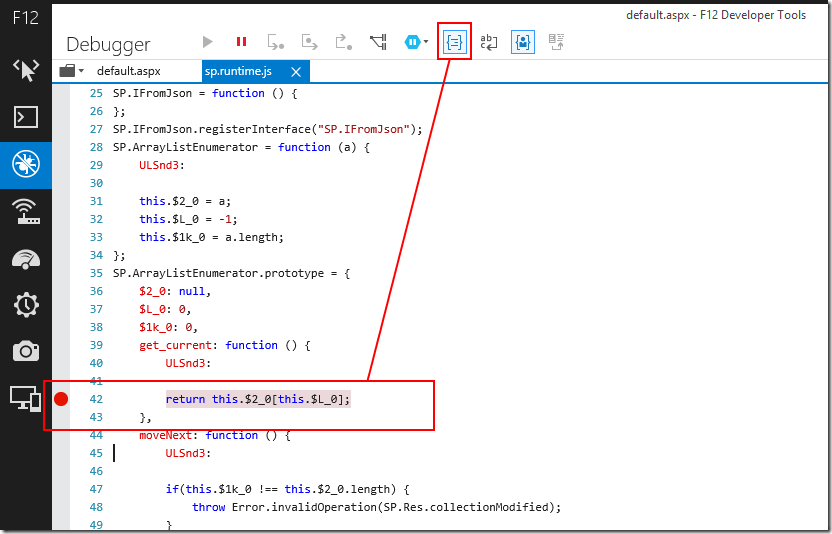
- Hit pretty-print - the sp.runtime.js becomes actually readable, and you can set line-based debugging too!
- I didn't switch to sp.runtime.debug.js - this is awesome!
10. Source Maps
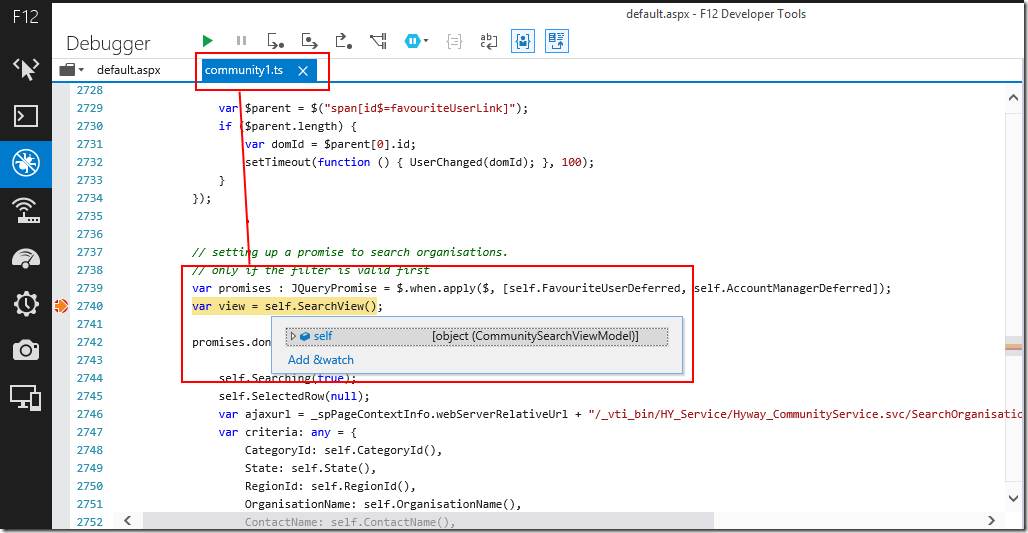
- Now finally we have source map support. Here is me debugging Typescript in IE11
Summary
- The developer story on IE11 (after this update) is awesome!
